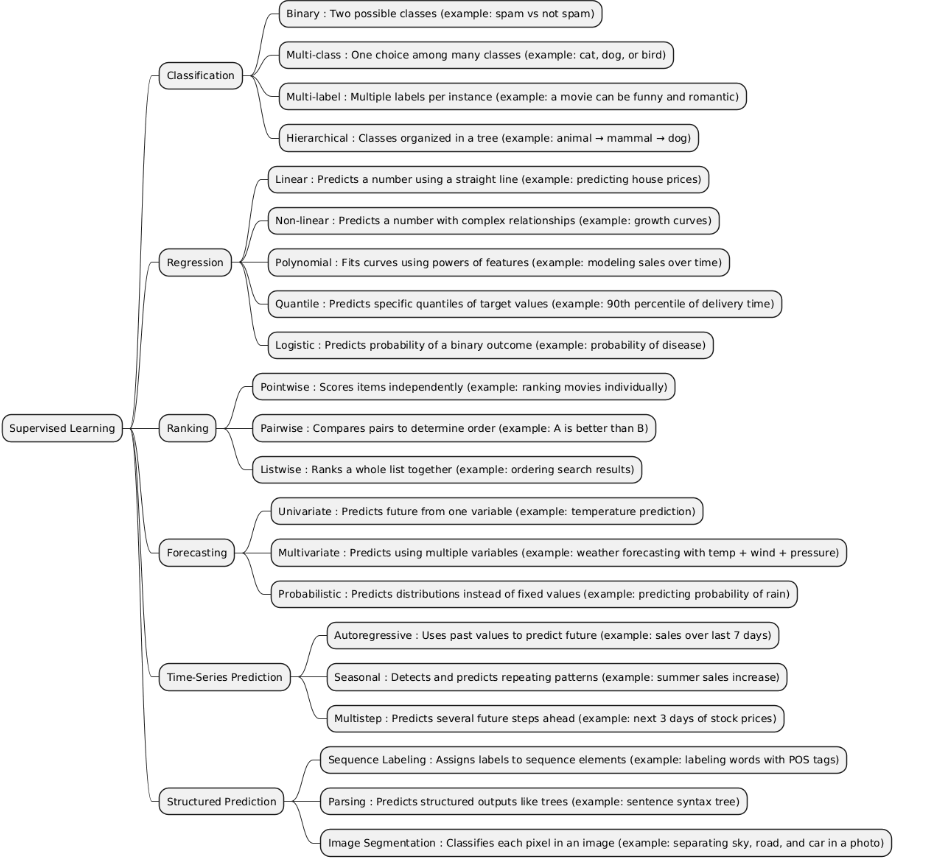
Supervised Learning is a type of machine learning where a model is trained using labeled data — meaning each training example has an input and a known correct output. The goal is for the model to learn the relationship between inputs and outputs so it can make accurate predictions on new, unseen data.
| Type | What it is | When it is used | When it is preferred over other types | When it is not recommended | Examples of projects that is better use it incide him |
|---|---|---|---|---|---|
| Regression | Regression is used to predict continuous numerical values (e.g., prices, temperatures, age, demand). It learns a function that maps input variables XXX to a real-valued output yyy. |
• When the target variable is a real number, not a category or rank. • When you want to estimate quantities or model trends. • Used in problems like predicting sales, temperature, income, or house prices. |
• Better than Classification when the output is continuous (not discrete labels). • Better than Ranking when you need exact numeric predictions, not just ordering. • Better than Forecasting / Time-Series if your data is not time-dependent (i.e., order doesn’t matter). • Better than Structured Prediction when you only need a single numeric output, not complex structures (like sequences or trees). |
• When the target variable is categorical → use Classification. • When there is strong time dependency → use Forecasting or Time-Series models. • When output involves relations between multiple variables (like sequences, labels, or spatial data) → use Structured Prediction. • When data is nonlinear and high-dimensional → regression may underperform unless you use nonlinear models (like SVR, neural networks). |
• Predicting house prices based on size, location, and age. • Estimating future sales from advertising and economic data (simple regression). • Predicting student test scores from study hours and attendance. |
| Classification | Classification predicts discrete categories or classes (e.g., spam/not spam, disease/healthy). The model learns to assign each input to one of several predefined classes. |
• When the target variable is categorical, not continuous. • When the goal is to decide or label something (yes/no, type A/B/C). • Used for diagnosis, detection, recognition, and categorization tasks. |
• Better than Regression when the output is a class label, not a numeric value. • Better than Ranking when order between outputs doesn’t matter — you just need correct class assignment. • Better than Forecasting/Time-Series when there’s no time dependency. • Better than Structured Prediction when each sample has a single independent label (not sequences or structures). |
• When the output is a real number → use Regression. • When data points are time-ordered or sequential → use Forecasting/Time-Series. • When outputs are structured or dependent (like sentence tagging or image segmentation) → use Structured Prediction. • When you need ranking or scoring instead of labeling → use Ranking. |
• Email spam detection (spam / not spam). • Medical diagnosis (disease type classification). • Image recognition (cat, dog, car, etc.). • Sentiment analysis (positive / neutral / negative). |
| Ranking | Ranking predicts the relative order or priority of items instead of exact values or classes. It learns how to sort items based on relevance, preference, or importance. |
• When the goal is to order or prioritize items (not classify or predict numeric values). • Common in search engines, recommendation systems, and information retrieval. • Used when relative comparison matters more than absolute prediction. |
• Better than Classification when you need order (e.g., rank 1 > rank 2), not just labels. • Better than Regression when the relative ranking is more important than the exact numeric value. • Better than Forecasting/Time-Series when there is no temporal component — just ordering among items. • Better than Structured Prediction when outputs are independent rankings, not interdependent structures. |
• When outputs are categories without order → use Classification. • When outputs are continuous numeric values → use Regression. • When data is time-based or sequential → use Forecasting/Time-Series. • When outputs involve complex structures or dependencies (like sequences or graphs) → use Structured Prediction. |
• Search engine results ranking (Google ranking pages by relevance). • Recommendation systems (ranking movies or products for a user). • Job candidate ranking by fit score. • Ad ranking by predicted click-through rate (CTR). |
| Forecasting | Forecasting predicts future values based on historical data. It focuses on estimating upcoming trends, demands, or events over time. |
• When the target depends on time progression. • When you need to predict the future using past observations. • Common in finance, sales, weather, and resource planning. |
• Better than Regression when temporal order matters — i.e., past influences future. • Better than Classification when outputs are continuous future values. • Better than Ranking because it models time dependencies, not item priority. • Better than Time-Series Prediction when you need longer-term or multi-step forecasts rather than short-term next-value prediction. • Better than Structured Prediction when outputs are independent future values, not complex structures. |
• When data has no time dependency → use Regression or Classification. • When you only need one next-step prediction → use Time-Series Prediction. • When predicting categories or ranks instead of numeric time-based values. • When data is too irregular or random — forecasting becomes unreliable. |
• Stock price forecasting for next week or month. • Electricity demand forecasting for power grid management. • Weather forecasting (temperature, rainfall, etc.). • Sales forecasting to plan inventory or marketing. |
| Time-Series Prediction | Time-Series Prediction predicts the next value(s) in a sequence based on past time-dependent data. It focuses on short-term or step-by-step future estimation. |
• When data is sequential and ordered by time. • When you need to predict the next point or a few future steps in a timeline. • Common in real-time systems, sensors, finance, and monitoring. |
• Better than Regression because it explicitly models temporal correlations. • Better than Forecasting when you need immediate next-step or short-term predictions instead of long-term trends. • Better than Classification or Ranking when predicting continuous or sequential data, not discrete outputs. • Better than Structured Prediction when the structure is simply a time sequence, not a complex relationship. |
• When data points are independent (no time relation) → use Regression or Classification. • When predicting categories or priorities → use Classification or Ranking. • When modeling complex dependencies beyond time (like multiple related sequences) → use Structured Prediction. • When goal is long-term forecasting rather than next-step prediction. |
• Predicting tomorrow’s temperature from recent weather data. • Next-hour electricity demand prediction. • Stock price next-minute prediction. • Predicting machine sensor readings for anomaly detection. |
| Structured Prediction | Structured Prediction predicts complex outputs with internal structure, such as sequences, trees, graphs, or sets of interdependent labels — not just single values or classes. |
• When the output has multiple related parts or dependencies. • When predicting structured data like sentences, images, or networks. • Common in NLP, computer vision, and bioinformatics. |
• Better than Classification when output is multiple dependent labels (e.g., part-of-speech tags). • Better than Regression when you need to predict structured objects, not single numbers. • Better than Ranking when items are interdependent, not just ordered. • Better than Forecasting / Time-Series when relationships are non-temporal (e.g., spatial or hierarchical). • Best when you must capture correlations between output variables. |
• When outputs are independent single values or labels → use Classification or Regression. • When data is purely time-based → use Forecasting / Time-Series Prediction. • When structure is simple or irrelevant — structured models add unnecessary complexity. • When you have small data — structured models often need lots of examples. |
• Named Entity Recognition (NER) – labeling words in a sentence as person, place, etc. • Image segmentation – assigning a class to every pixel. • Speech recognition – converting audio to text sequences. • Dependency parsing – building a syntactic tree for a sentence. |
import numpy as np
from sklearn.model_selection import train_test_split
from sklearn.linear_model import LogisticRegression
from sklearn.metrics import accuracy_score

X = np.array([
    [1, 2],
    [2, 1],
    [2, 3],
    [3, 2],
    [6, 5],
    [7, 7],
    [8, 6],
    [7, 5]
])
y = np.array([0, 0, 0, 0, 1, 1, 1, 1])

X_train, X_test, y_train, y_test = train_test_split(X, y, test_size=0.25, random_state=42)

model = LogisticRegression()
model.fit(X_train, y_train)

y_pred = model.predict(X_test)
accuracy = accuracy_score(y_test, y_pred)
print("Predicted labels:", y_pred)
print("Accuracy:", accuracy)
import numpy as np
from sklearn.model_selection import train_test_split
from sklearn.linear_model import LogisticRegression
from sklearn.metrics import accuracy_score

X = np.array([
    [1, 2],
    [2, 1],
    [2, 3],
    [3, 2],
    [6, 5],
    [7, 7],
    [8, 6],
    [7, 5],
    [0, 1],
    [1, 0]
])
y = np.array([0, 0, 0, 0, 1, 1, 1, 1, 2, 2])

X_train, X_test, y_train, y_test = train_test_split(X, y, test_size=0.25, random_state=42)

model = LogisticRegression(multi_class='multinomial', solver='lbfgs')
model.fit(X_train, y_train)

y_pred = model.predict(X_test)
accuracy = accuracy_score(y_test, y_pred)
print("Predicted labels:", y_pred)
print("Accuracy:", accuracy)
import numpy as np
from sklearn.model_selection import train_test_split
from sklearn.linear_model import LinearRegression
from sklearn.metrics import mean_squared_error

X = np.array([[1], [2], [3], [4], [5], [6]])
y = np.array([3, 5, 7, 9, 11, 13])

X_train, X_test, y_train, y_test = train_test_split(X, y, test_size=0.33, random_state=42)

model = LinearRegression()
model.fit(X_train, y_train)

y_pred = model.predict(X_test)
mse = mean_squared_error(y_test, y_pred)
print("Predicted values:", y_pred)
print("Mean Squared Error:", mse)
print("Learned coefficients:", model.coef_, "Intercept:", model.intercept_)
import numpy as np
from sklearn.linear_model import LinearRegression
import matplotlib.pyplot as plt

t = np.array([1, 2, 3, 4, 5, 6, 7, 8, 9, 10])
y = np.array([2.1, 4.0, 6.1, 8.2, 10.0, 12.1, 14.1, 16.2, 18.0, 20.1])

X = t[:-1].reshape(-1,1)
y_target = y[1:]

model = LinearRegression()
model.fit(X, y_target)

y_pred = model.predict(X)
print("Predicted next values:", y_pred)

plt.plot(t[1:], y_target, label='Actual')
plt.plot(t[1:], y_pred, label='Predicted', linestyle='--')
plt.xlabel("Time")
plt.ylabel("Value")
plt.title("Univariate Forecasting")
plt.legend()
plt.show()
import torch
import torch.nn as nn
import torch.optim as optim

X = torch.tensor([
    [1, 2, 3],
    [4, 5, 6]
], dtype=torch.long)

y = torch.tensor([
    [0, 1, 0],
    [1, 0, 1]
], dtype=torch.long)

vocab_size = 10
embedding_dim = 5
hidden_dim = 8
num_classes = 2

class SeqLabelingModel(nn.Module):
    def __init__(self, vocab_size, embedding_dim, hidden_dim, num_classes):
        super().__init__()
        self.embedding = nn.Embedding(vocab_size, embedding_dim)
        self.lstm = nn.LSTM(embedding_dim, hidden_dim, batch_first=True)
        self.fc = nn.Linear(hidden_dim, num_classes)

    def forward(self, x):
        emb = self.embedding(x)
        out, _ = self.lstm(emb)
        out = self.fc(out)
        return out

model = SeqLabelingModel(vocab_size, embedding_dim, hidden_dim, num_classes)
criterion = nn.CrossEntropyLoss()
optimizer = optim.Adam(model.parameters(), lr=0.01)

for epoch in range(200):
    optimizer.zero_grad()
    outputs = model(X)
    loss = criterion(outputs.view(-1, num_classes), y.view(-1))
    loss.backward()
    optimizer.step()

with torch.no_grad():
    outputs = model(X)
    predicted = torch.argmax(outputs, dim=2)
    print("Predicted sequence labels:")
    print(predicted)